|
Click to set custom HTML
0 Comments
Los Angeles Angels GM Perry Minasian said recently that Mike Trout will not be traded this offseason. Specifically, he said, “Right now, he’s our center fielder. He’s had injuries, but I don’t necessarily believe it’s because of playing center field. His hamate injury was not because he was tracking balls in center field. But if we asked Mike to play left, right or even third, he’d do it. It’s about the team and making it as good as it gets. But we haven’t had any discussions.” It’s funny that Minasian casually, and surely facetiously, tossed third base into the mix considering that’s the spot of Anthony Rendon, who has missed even more games to injuries than Mike Trout over the last few years. Minasian made his comments on Trout because there have been suggestions that the team might as well trade Trout since they’re lost free agent Shohei Ohtani to the cross-town rivals, of all people. It may be time to start over in Anaheim and give Trout a fresh start elsewhere. As baseball fans know, Mike Trout missed significant time with an injury in 2023, making it three straight years with IL stints. Since the start of the 2021 season, he has played in just 237 of the Angels’ 486 games. That’s 49 percent and helps explain why the Angels have played at a 74-88 pace over those three seasons despite having two of the greatest players who ever lived, Mike Trout and Shohei Ohtani. Missing time with an injury is not new for Trout, but it wasn’t always this way. After playing 40 games in the major leagues as a 19-year-old in 2011, Trout started the 2012 season in AAA before being promoted to the show on April 28. He went on to play in 139 of the team’s remaining 142 games. He continued to post consistently for the next four years, playing 157, 157, 159, and 159 games. He wasn’t going after the ironman streaks of Lou Gehrig or Cal Ripken, Jr., but only three players in baseball played more games than Trout from 2013 through 2016 (Evan Longoria, Kyle Seager, and Robinson Canó). During this ascendent part of his career, Trout established himself as one of the greatest young players of all time, right there with such legendary names as Ty Cobb, Mel Ott, Rogers Hornsby, Mickey Mantle, Ted Williams, and Jimmie Foxx. Consider where Trout ranked in FanGraphs WAR through the following ages: Most WAR through age 21:
Most WAR through age 22:
Most WAR through age 23:
Most WAR through age 24:
Through age-24, at the end of the 2016 season, Trout was right there with Ty Cobb on the list of greatest young players in baseball history. He was a perennial all-star and Silver Slugger Award winner, while also winning the 2012 AL Rookie of the Year Award and AL MVP awards in 2014 and 2016. He finished second in AL MVP voting in 2012, 2013, and 2015. On the field, he led the league in runs scored four times in his first five full seasons, RBI once, stolen bases once, and finished in the top four in wRC+ in five consecutive seasons (wRC+ is an offensive metric that credits a hitter for each outcome of his plate appearances and is set so that 100 is league average and a number above 100 means the player was that far above league average). He already had a career’s worth of accolades and wasn’t yet 25 years old. Mike Trout’s future was as bright as any young player in the history of baseball. Trout’s first major injury came on May 29, 2017, during his age-25 season when he tore a ligament in his left thumb while sliding into second base on a stolen base attempt. It looks simple enough watching the video. He just slid too hard into the base and didn’t have one of those oven mitt sliding gloves to protect his hand. The injury cost him 39 games, about a quarter of a season. He still finished the season with 6.3 WAR, but dropped a bit behind Cobb on the “best position players through age 25” leaderboard. Most WAR through age 25:
In 2018, Trout was having another incredible season when he was once again injured on a slide. This time, he jammed his wrist during a feet-first slide into third base in a game against Tampa Bay on August 1. He missed 19 games, but his 9.5 WAR in 140 games was still second among position players to only Mookie Betts and he gained some ground on Ty Cobb despite the injury. Most WAR through age 26:
Trout didn’t go on the IL in 2019. He played in 134 games, had 600 plate appearances and led MLB position players in WAR, at 8.3, while winning his third AL MVP Award. This allowed him to jump back ahead of Ty Cobb on the leaderboard, now for position players through age 27. Most WAR through age 27:
The shortened 2020 season was a hit to Trout’s placement on the “best position players through age X” standings. He was healthy enough to play in 53 of the Angels’ 60 games, but his 160 wRC+ was the lowest of any full season of his career to that point and he finished with 2.5 WAR, which ranked ninth in MLB among position players. That’s still great, but not greatest. We’ll never know for sure, but the shortened season may have cost him 3 to 5 WAR. By season’s end, he had dropped behind Cobb, Hornsby, and Mantle on the “best position players through age 28” leaderboard. Most WAR through age 28:
It’s easy to forget now because of what happened later in the season, but Mike Trout came out of the gate scorching hot in 2021. He hit 6 homers, scored 15 runs, and had 14 RBI in his first 18 games, while hitting .426/.540/.820. He had an incredible 255 wRC+. He slowed down a bit over the next few weeks, but was still hitting .333/.466/.624 and leading the league in wRC+ (189) and WAR (2.2) through May 17. He was back in his rightful place as the best player of his generation. Then another injury hit. It seemed innocuous at first. Trout felt something in his calf and walked gingerly off the field at the end of an inning. It was initially reported that he would miss six-to-eight weeks. Instead, he missed the rest of the season; 122 games. Before the injury, Trout played in 36 of the Angels’ 40 games and looked well on his way to another 8-WAR season instead of the 2.2 WAR he finished with. His rankings on the “most WAR” leaderboard took another hit. Most WAR through age 29:
Heading into the 2022 season, Mike Trout had spent time on the IL for two injuries suffered during slides and an unusual strained calf injury that was slow to heal. It was unusual because there didn’t seem to be one specific move that caused it. The 2022 season began and Trout was good, but statistically not the best player in baseball as the calendar approached mid-July. Through July 12, he was sixth in wRC+ and 11th in WAR among position players. He was still slugging the ball as well as ever (.599 SLG), but his on-base percentage was surprisingly low for him, at .368. Then, sadly, another injury. After coming out of a game on July 12, Trout was initially diagnosed with back spasms, but his IL designation was rib cage inflammation. Jeff Fletcher of the Orange County Register reported that Trout had a rare condition called “costovertebral dysfunction at T5.” There was some concern that it would be a career-threatening injury, but Trout returned to the lineup in August and hit .308/.370/.688 (191 wRC+) over his last 40 games. Despite only playing in 119 games, Trout was worth 6 WAR in 2022 and moved up a spot on the “best position players through age 30” list. Most WAR through age 30:
That brings us to 2023, Trout’s age-31 season. Trout played in 81 of the Angels’ first 87 games, but he wasn’t his typical self. He came into the season with a career batting line of .303/.415/.587, good for a 172 wRC+. Through his first 81 games, he was hitting .263/.369/.493, a 134 wRC+, which was by far the lowest of his career other than his 40-game stretch as a 19-year-old in 2011. He was valued at 3.0 WAR, 12th in baseball. Still good, but not your typical healthy Mike Trout ranking. On July 3, Trout took a swing on a Nick Martinez pitch and suffered an injury. The next day, he was placed on the IL with a fractured hamate bone in his left hand. He was expected to miss 6-to-8 weeks. He missed seven weeks, then came back and played just one game before going back on the IL. He never got back on the field and another season ended early for him. He finished with 3.0 WAR. Despite all of the missed time due to injuries and the shortened 2020 season, Trout is still in the top ten in WAR among position players through the age of 31, between Mel Ott and Lou Gehrig. Most WAR through age 31:
Where Does Trout Go from Here? Mike Trout is already a first-ballot Hall of Famer, but with his recent injury history it’s interesting to consider where he will end up on the all-time WAR leaderboard. The chart below left shows the top 20 players in WAR through age-31, where they finished in career WAR, their career WAR rank, and the WAR they earned from age 32 on. The chart below right shows the top 20 in all-time career WAR. 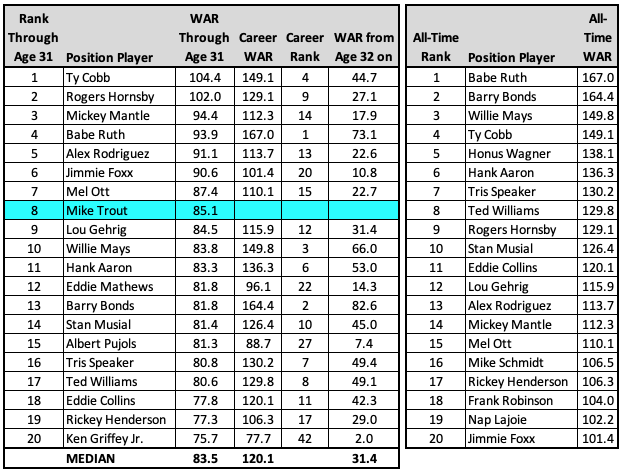
Mike Trout has seven years left on his contract with the Angels, which covers his age-32 through age-38 seasons. He was a 6 WAR player in 119 games in 2022. He was worth 3 WAR in 82 games played this year, which would make him roughly a 5-WAR player if he was healthy enough to play 130-140 games. This could be who he is now. If he ages at least somewhat typically going forward, he could add another 25 WAR by the time his contract with the Angels is over. That would put him in the range of a top-15 player all-time, right there with Mickey Mantle and Mel Ott. What would be the most-optimistic scenario? Well, there’s Barry Bonds, who is the all-time leader in WAR from age 32 on, with 82.6 WAR. He basically had two Hall of Fame careers, which some might consider pre-PED use and post-PED use, although there were other contributing factors to the high-offense of that time. This website by statistical analyst Eric Walker is a deep dive into the issue of steroids and baseball. Other players on this list had good late-career runs. Willie Mays was very good in his 30s, with six seasons with 5 WAR or greater from age 32 on. Hank Aaron had seven seasons with 5 WAR or greater from age 32 on. Ted Williams had five such seasons and was essentially just as good an older hitter as he was a younger hitter (188 wRC+ from age 20 to 31; 185 wRC+ from age 32 on). There were also some notable players who didn’t age as well. Mickey Mantle had nine straight seasons with at least 6 WAR from age-22 through age-30, then never reached that level again. He retired after his age-36 season. Albert Pujols, Trout’s longtime teammate on the Angels, began his career with 10 straight years with at least 5 WAR, then never reached 5 WAR again. He was below replacement-level in five of his last eight seasons. Then there was Ken Griffey, Jr., who had 75.7 WAR through age 31, good for 20th all-time through age 31. Although he continued to hit a good number of home runs, injuries limited his playing time and his defense took a major hit, which cut into his value. He had just one above-average season from age 32 on, along with five below replacement-level seasons, and finished with 77.7 WAR, ranking 42nd all-time among position players. Despite all the recent injuries and missed time, Mike Trout is still more likely than not to finish his career as a top-20 position player all-time. If the second half of his career is more like Willie Mays or Hank Aaron than Albert Pujols or Ken Griffey, Jr., he could still crack the top five. The post The Legacy of Mike Trout appeared first on Off The Bench. via Off The Bench https://www.offthebenchbaseball.com/2023/12/10/the-legacy-of-mike-trout/?utm_source=rss&utm_medium=rss&utm_campaign=the-legacy-of-mike-trout While Ronald Acuña Jr. made headlines with an incredible 73 steals in 2023, becoming the first player since Jose Reyes in 2007 to reach that mark, there was another player who achieved a much less celebrated act on the field more times than anyone since 1997. His name is Ty France and he plays first base for the Seattle Mariners. His forte is getting hit by pitches. Ty France is a modern-day Coach Ernie Pantuso of Cheers fame, whose specialty was getting beaned. In the fictional TV world of Cheers, Coach led the league in hit by pitches two times. For a younger crowd, Ty France is a modern-day Howie from The Benchwarmers. Like Coach Pantuso, except in real life, Ty France has led the league in getting hit by pitches twice. He was hit a league-leading 27 times in 2021 and 34 times in 2023. Those 34 HBP last year were the most in the big leagues since Craig Biggio was also hit 34 times back in 1997. It was also the third-highest total in MLB since the beginning of the Integration Era in 1947. The only two hitters to get beaned more often than France and Biggio since then were the King of the HBP, Ron Hunt, who was hit 50(!) times in 1971, and Beefy Don Baylor who was hit 35 times in 1986. 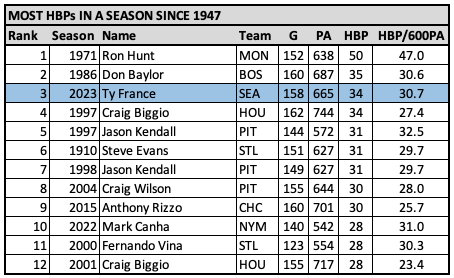
Hunt’s 50-HBP season in 1971 is a massive outlier when it comes to the gap between the record holder and the next-closest player in a particular statistic. As this article shows, his record 50 HBP in a season is 13 standard deviations above average for HBP in a season since 1901. Statistically, the 43 percent gap between Hunt and Baylor is greater than the gap between Joe DiMaggio’s 56-game hitting streak and Pete Rose’s 44-game hitting streak. Hunt had a technique for getting hit. “First I would blouse the uniform — this big, wool uniform, I would make sure it was nice and loose,” Hunt said. “Then I’d choke way up on the bat, and stand right on top of the plate. That way, I could still reach the outside pitch. That was the Gil Hodges philosophy on hitting: The two inches on the outside corner were the pitcher’s, the rest was his. I thought, ‘If I can take away those two inches, and he’s not perfect, I can put the ball in play and get some hits. And if he comes inside, I can get on base that way, too.’” Hunt mastered the technique of crowding the plate with his left arm near the strike zone, then turning away to look like he was trying to avoid the pitch while at the same time leaving his arm, shoulder, or back exposed to take the plunking and a free pass to first base. And he did it without the modern elbow pads that many players wear. Ty France hasn’t been as prolific as Hunt, but he’s been the best in the business at getting beaned since he became a regular for the Mariners in 2021. In addition to leading the league twice in the last three seasons, his total of 82 HBP is 10 more than the next player on the list, Mark Canha (72 HBP), and 24 more than the player after Canha, Anthony Rizzo (58 HBP). In 2023, France was hit by a 92-mph sinker from one of the best pitchers in baseball, Shohei Ohtani, and by a lesser-known pitcher named Jake Bird on an 85-mph slider. He was hit by right-handed pitchers on balls that were just slightly up and in and by lefties on pitches that were a bit further from the plate. He was even hit on a 77-mph batting practice fastball thrown by position player Matt Duffy. At bat, France stands close to the plate, with his back foot not far from the corner of the batter’s box closest to the catcher and umpire. His padded-up elbow hangs over the white line of the inside part of the box and often takes the brunt of the incoming pitch as France makes little effort to get out of the way. Getting beaned is not new for Ty France. In the minor leagues from 2016-2018, he was hit 28, 27, and 27 times. Even back in college as a San Diego State Aztec, France was hit 14, 14, and 20 times in about half as many plate appearances each season as he’s had in his major league seasons. The benefit to getting beaned has been a significant boost to France’s on-base percentage. He’s consistently had an OBP about 30 points higher than he would have if he had not been hit by any pitches at all. A more realistic comparison would be if France was hit at a league average rate, his .348 OBP over the last three seasons, which ranks 46th among 226 qualifying hitters, would be .327 and rank 110th. All that pain has a purpose. It adds value to the team. France also happens to play in an era in which hit by pitches are at their peak. The 2023 season tied with the 2021 season for the most HBP ever, at 2,112 (shoutout to Rush’s Geddy Lee, an avid baseball fan and collector). The 2020 season had a higher rate of HBP/600 PA than 2021 or 2023, as shown below, but that was the shortened 2020 season so the raw number of HBP wasn’t as great. The graph below shows the increase in HBP rate since 1947. That year, there were an average of 2.3 HBP per 600 plate appearances. In 2023, that rate was three times as high, at 6.9 HBP/600 PA. Eight of the top 11 career HBP leaders are identified on the graph. The other three players in the top 11 are Hughie Jennings (287 HBP), Tommy Tucker (272 HBP), and Dan McGann (230 HBP), who all played parts of their careers in the late 1800s, when baseball was quite a bit different. 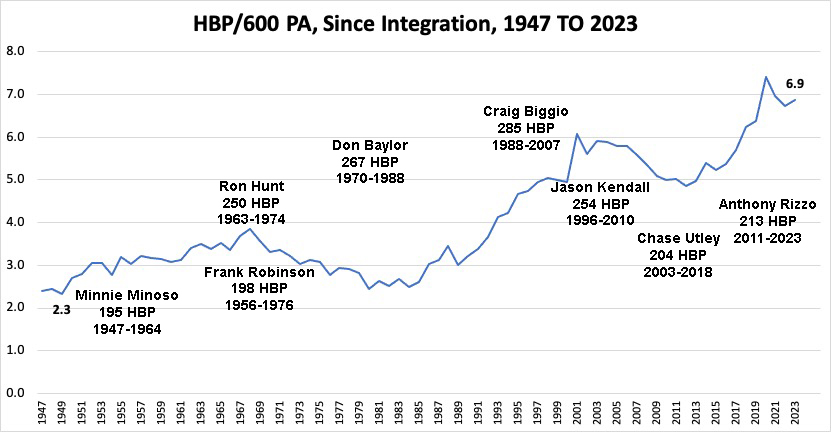
After making the jump from the New York Cubans of the Negro National League II, Minnie Miñoso became a full-time player in the American League in 1951. He led the AL in HBP 10 times in the next 11 years. In 1956, Frank Robinson came up with the Cincinnati Reds and led the NL in HBP in his rookie year. He would repeat that feat five more times, then lead the AL in 1969, for a total of 7 times leading the league in HBP. A contemporary of Robinson was the aforementioned Ron Hunt, the man who was hit 50 times in 1971, which occurred during a stretch in which he led the NL in HBP for seven consecutive seasons. 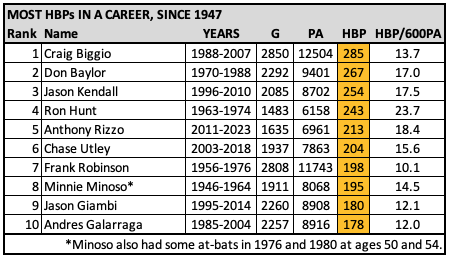
Just as Ron Hunt was winding down his career, Don Baylor arrived. He first led his league in getting beaned in 1973 and did it for a final time in 1987. Altogether, he was the top human pincushion in his league eight times, including four years in a row from 1984 to 1987. Craig Biggio broke into the show in Baylor’s final season, 1988, but didn’t top the HBP leaderboard until 1995. He led his league five times, including three times in a row in the mid-1990s, and is the modern leader in taking one for the team. Jason Kendall only led the league once, which is surprising considering he was hit 254 times in his career. In more recent years, Chase Utley led the league in HBP three straight years from 2007 to 2009, and some of those HBPs caused a ruckus. Anthony Rizzo led the league three times in five years from 2015 to 2019, which did not include the time he swung on and missed a pitch that hit him in the hip. And that leads us back to the 2020s Baron of Beanings, Ty France. The post Seattle Mariners Ty France, the Baron of Beanings appeared first on Off The Bench. via Off The Bench https://www.offthebenchbaseball.com/2023/11/27/seattle-mariners-ty-france-the-baron-of-beanings/?utm_source=rss&utm_medium=rss&utm_campaign=seattle-mariners-ty-france-the-baron-of-beanings Success isn’t just for the sports field! Those tricks that athletes use to reach the top of their game, you can totally apply them to crush it in whatever life throws your way – whether you’re gunning to be the next sports star or aiming high in your job, school, or personal life. So, here’s the lowdown on strategies for success on and off the field: Goal SettingThink of this like setting your GPS destination. Athletes set their eyes on clear, achievable goals on the field. In real life, it’s no different. Figure out what “success” means to you, and map out a plan to get there. Chop those goals into smaller, doable bits to keep your fire burning. Work EthicsYou know athletes are dedicated to training and practice, right? Well, you have to do the same in your gig. Whether you’re sweating it out at the gym, grinding in the office, or hitting the books, that strong work ethic is your secret weapon. Consistent hard graft pays dividends, no matter where you’re at. DisciplineDiscipline is your trusty sidekick in the success game. Athletes follow strict routines, and you should, too. Prioritize your tasks, manage your time like a champ, and keep your eyes on the prize. Discipline is your shield against distractions and keeps you on a path to success. Keep on LearningAthletes are always honing their skills and staying up to date with the latest tricks of the trade. In everyday life, soak up knowledge like a sponge. Embrace the idea that you’re never done learning and growing. Be open to fresh insights and experiences – it’s like a secret sauce for success. TeamworkTeam sports teach you how to play well with others. Remember, success often rides on working smoothly with your squad. In your job or personal life, build solid relationships, be a team player, and show props to your peeps. Teamwork is the glue that holds success together. AdaptabilityJust like athletes adapt to unexpected moves on the field, you need to be flexible in life. Change is a given. Be ready to shift your plans when life throws a curveball your way. Flexibility and adaptability are your trusty allies. Mental Toughness MattersAthletes are masters of the mental game, staying cool under pressure. In real life, mental toughness is pure gold. Build a rock-solid mindset that can take on stress, setbacks, and challenges without breaking a sweat. Believe in yourself, and you’ll conquer any hurdles. Healthy LifestyleAthletes eat right, exercise, and catch their sleep. Off the field, keep up that healthy lifestyle. Good food, regular exercise, and enough sleep fuel your energy and brainpower – essential for reaching your goals. Passion and Dedication:Athletes are fueled by their love for their sport. You have to find your passion and go all in. Dedicate yourself to what lights your fire. Passion and dedication are your turbochargers, propelling you further than you ever thought possible. Seek GuidanceAthletes often have coaches and mentors. Take a page from their playbook – seek advice from folks who’ve been around the block. Learning from others can supercharge your path to success. In a nutshell, success isn’t limited to sports; it’s a universal dream. To get there, borrow a few moves from athletes. These moves aren’t just for the field; they’ll help you grow and thrive in all areas of life. So, go out there and rock your success story, champ! The post Strategies for Success On and Off the Field first appeared on Louis DeTitto's Sports Blog. via Louis DeTitto's Sports Blog https://louisdetitto.net/strategies-for-success-on-and-off-the-field/?utm_source=rss&utm_medium=rss&utm_campaign=strategies-for-success-on-and-off-the-field Entrepreneurship is not all about having the best business idea or state-of-the-art product, but it also has to do with having the right mind and psychology. Successful entrepreneurs have a mental state of mind that combines some traits and behaviors that are uncommon among the rest. The psychology of successful entrepreneurs has been informative to those who want to be entrepreneurs in the future. In this article, we shall analyze the chief psychological factors that contribute to entrepreneurial success. Resilience and PersistenceThe term ‘resilience’ means the ability of a person to bounce back from failures and setbacks. Successful entrepreneurs undergo many challenges in their journey, but what makes them different is that they are very committed to surmounting these challenges. They see failures as part of the learning process and not barriers. This resilience allows them to face all odds until they can achieve their goals. Risk ToleranceEntrepreneurship, by nature, is characterized by a lot of risks. Successful entrepreneurs have a higher risk tolerance compared to an average person. They are ready to take chances on a calculated basis and know that where there is no risk, many times, there could not be any reward. But it must be said here that this risk tolerance is not on chance; instead, it’s based upon diligent analysis yet preparedness to change or adapt if need be. Innovation and CreativityEntrepreneurship is innovation. The best entrepreneurs are creative thinkers who always look for innovative ways of solving problems. They have an open mind for new ideas and approaches, always thinking outside the box and challenging existing orders at each turn in their journey. This innovative mindset allows for unique products, services, or business models, differentiating them from their competition. AgilityThe business environment is dynamic, and successful entrepreneurs are fast adjusting to the dynamics. They do not lock their plans, but they are flexible and ready to respond. They can, at any given time, make a U-turn when need be, grab new opportunities, or even change strategies with changing market forces. Vision and PassionPassion is the driving force behind successful entrepreneurs. They have a great interest in the ideas and results of their ventures, and that is why they tend to be determined and work hard. Successful entrepreneurs have an appealing vision for their businesses as well. Their vision becomes that compass that will drive their decisions and actions, such that they are able to propel their team in one single direction. Efficient Time ManagementEntrepreneurs often have to think about many aspects, and hence, being good time managers is a must. Successful entrepreneurs are known for managing their time – they know how to prioritize their work as well as set goals that can be achieved. They do not let themselves get distracted by distractions but instead use the value of their time more wisely so that in less time, they can do more jobs. Strong Decision-Making SkillsEntrepreneurs always make decisions daily that can either build or affect the success of their ventures. Successful entrepreneurs are brilliant decision-makers who can weigh up both sides and possibilities, think about multiple perspectives, and make strategic life choices toward accomplishing their goals. Such leaders know that decision-making is part of their responsibility, and the fear of making mistakes does not freeze them. Networking and Relationship BuildingBuilding relationships and networking are vital aspects of entrepreneurship. At the same time, successful entrepreneurs networked with mentors, partners, investors, and customers in networking environments. They cherish the relationships they build and put time as well as effort into their friendships. Networking provides them with valuable resources and support. The psychology of successful entrepreneurs is a mixture of characteristics and conducts that allow them to succeed in a highly competitive and continuously changing business environment. These psychological traits listed in this blog are essential in carving their success. Appreciation and development of these psychological factors can be an advantage for anyone who wants to start his own business. Ultimately, it is more than what entrepreneurs do but how they think and approach the problems that set them on a path to success in business. The post The Psychology of Successful Entrepreneurs first appeared on Louis DeTitto | Business. via Louis DeTitto | Business https://louisdetitto.com/the-psychology-of-successful-entrepreneurs/?utm_source=rss&utm_medium=rss&utm_campaign=the-psychology-of-successful-entrepreneurs With World Series MVP Corey Seager hitting bombs for Texas and Corbin Carroll or Ketel Marte using their power and speed to spark the Diamondbacks, this year’s World Series was a showcase for the number two spot in the batting order. The number two spot is where it’s at these days. All the cool teams have their best players hitting second. Well, maybe not all; the Atlanta Braves hit Ronald Acuña Jr. leadoff and he is incredible, but many good teams bat players second who in previous eras would have batted third or fourth. In addition to Corey Seager, who batted second every time he came to the plate for Texas in the regular season, we saw Freddie Freeman of the Dodgers, Aaron Judge of the Yankees, Alex Bregman of the Astros, Adley Rutschman of the Orioles, Bobby Witt Jr. of the Royals, and Jorge Soler of the Marlins as some of the top hitters on their respective teams who had more than 400 plate appearances in the number two spot. It makes sense to put a good hitter second in the lineup. In fact, as simple as it sounds, it makes sense to put good hitters in the top three spots in the order because that’s where the most plate appearances are. Over the course of the 2023 season, each spot down the order had an average of 18 fewer plate appearances than the one before it. Many teams have figured this out in recent years and adjusted their lineups accordingly. It wasn’t always like this. For more than a century, teams routinely put their best hitters third or fourth, the legendary spots of Babe Ruth and Lou Gehrig, who were also given uniform numbers to match their place in the batting lineup. Managers typically wanted a fast guy batting leadoff and a guy who could “handle the bat” hitting second. Ideally, the fast guy would get on base and possibly steal a bag or two. Failing that, the scrappy number two hitter could bunt him over or move him up on a hit-and-run play. Then came the team’s best two hitters with a chance to drive in the run. This is how it was 100 years ago and how it remained for decade after decade, generation after generation. Babe Ruth batted third or fourth in 95 percent of the games he started. Joe DiMaggio hit third or fourth in 98 percent of his starts. Stan Musial (90%), Willie Mays (84%), Hank Aaron (94%), Willie Stargell (83%), Mike Schmidt (81%), and Ken Griffey Jr. (88%) continued the trend through the 1950s, the 1970s, the 1990s and into the 2000s. Barry Bonds batted leadoff and fifth early in his career, then moved to third or fourth for the bulk of his games started (65%). Unlike many of today’s top players, Bonds rarely batted second, making just 25 of his 2848 starts in the number two spot. In today’s game, he would very likely hit second, where he would be assured of striking fear in the heart of every pitcher in the first inning of every game. The shift to getting better hitters higher in the lineup happened over the last dozen or so years. The following chart shows the wRC+ by batting order position from 2009 to 2023. Found at FanGraphs, wRC+ is a hitting metric that adjusts for league and ballpark effects so players can more easily be compared across seasons and eras. A 100 wRC+ is league average, with anything above 100 being better than league average and below 100 being worse than league average. For example, this year Corey Seager had a 169 wRC+, meaning he was 69 percent better than league average on offense. The chart below shows wRC+ by lineup spot over the last 15 seasons, with the most productive lineup spot highlighted in green, second-most in yellow, and third-most in blue. It reveals the movement by teams to get more productive hitters in the number two spot beginning around 2014-2015, with another shift in 2019, when number two hitters outhit number three hitters for the first time. 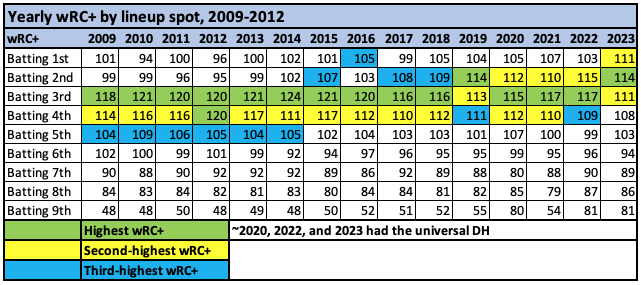
From 2009 to 2013, there were five straight years in which the number two spot finished with a wRC+ from 95 to 99, which is below league average. Hitters in that spot have been above average every year since. From 2014 to 2018, number two hitters had five seasons with a wRC+ from 102 to 109. From 2019 to 2023, they upped their performance to the 110 to 115 range each season. Considering historical trends, it’s likely the 2023 seasons was the first time the top three spots in the lineup had the top three wRC+ marks. It only took 148 years for MLB teams to figure out their best hitters should get the most plate appearances. We can put some names to these numbers by looking at the evolution of the number two spot in the lineup over the last 20 years. The chart below shows the top ten players sorted by plate appearances while in the second spot in the lineup, with their wRC+ over each time period. Players shown in green had a wRC+ higher than 120. Players in yellow had a wRC+ from 100 to 119. Players in red had a below-average wRC+. 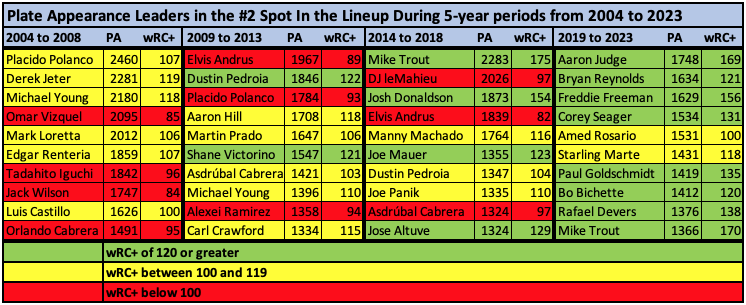
From 2004 to 2008, there were no hitters among the top ten in plate appearances in the number two spot who achieved a 120 wRC+. Four of the top ten were below-average, with the other six coming in between 100 and 119. Omar Vizquel had over 2000 plate appearances batting second despite his 85 wRC+ while in that spot in the order. Jack Wilson was similarly futile, yet hit near the top of the order on a regular basis. Teams were just giving up outs right and left with hitters coming to the plate directly in front of their best bats. There is improvement in the 2009 to 2013 range, with a couple of players--Dustin Pedroia and Shane Victorino—topping the 120 wRC+ mark while getting significant playing time in the number two spot. Unfortunately, there were also Elvis Andrus, Placido Polanco, and Alexie Ramirez and their below-average hitting wasting too many at-bats in a prime lineup spot. From 2014 to 2018, we begin to see the transformation, with power hitters Mike Trout and Josh Donaldson appearing on the list. They were the canaries in the coal mine. Trout hit leadoff in all of his starts in his first full season in 2012, then was shifted down the lineup in 2013, making 57 percent of his starts in the number two spot, 32 percent in the number three spot and 11 percent batting leadoff. In 2014, the transformation was complete, as he started 155 of his 157 games in the second spot. That was the same year that Josh Donaldson started hitting second regularly. From 2019 to 2023, the leaderboard for plate appearances by number two hitters is filled with elite hitters, including Aaron Judge, Freddie Freeman, Corey Seager, Paul Goldschmidt, Rafael Devers, and Mike Trout, all of whom were well above average in wRC+. At 118, Starling Marte just missed the 120 wRC+ cut. The outlier is Amed Rosario and his perfectly average 100 wRC+. Considering the players show above, it’s not surprising that number two hitters have improved in both on-base percentage and slugging percentage. Teams have moved their best hitters up in the lineup and top hitters have good on-base skills and hit for power. That being said, there appears to be a decided emphasis on hitting for power in the number two spot in recent years. The chart below shows how the number two spot in the lineup compared to the MLB average in on-base percentage, slugging percentage, and isolated power (slugging percentage minus batting average) from 2013 to 2023. 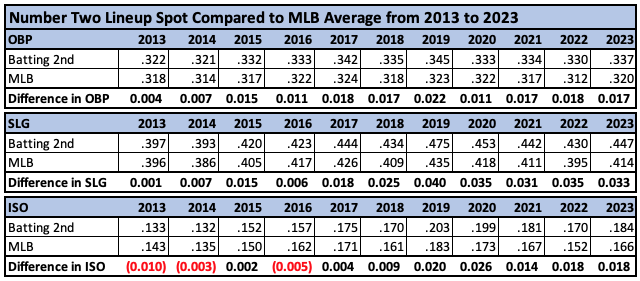
The 2015 season saw a big jump in teams getting better on-base production from the number two spots, while the 2019 season appears to be a dividing line for power hitters, with number two hitters significantly improving their slugging percentage and isolated power from previous seasons. This was also the big “year of the home run,” but number two hitters have continued to hit for more power than their predecessors even as fewer home runs have been hit overall the last few seasons. Now that we’ve had a good stretch of seasons with great hitters batting second, it seems ridiculous that it took so long. The last time the Texas Rangers were in the World Series was 2011. Their number two hitter that year was also a shortstop. It was Elvis Andrus, who hit .274/.343/.358, with five home runs and a 91 wRC+ when batting second. This year, it was Corey Seager, who hit .327/.390/.623, with 33 home runs and a 169 wRC+. What a difference a dozen years makes. The post World Series Teams Showcased the Number Two Spot in the Lineup appeared first on Off The Bench. via Off The Bench https://www.offthebenchbaseball.com/2023/11/09/world-series-teams-showcased-the-number-two-spot-in-the-lineup/?utm_source=rss&utm_medium=rss&utm_campaign=world-series-teams-showcased-the-number-two-spot-in-the-lineup Houston Astros second baseman Jose Altuve just had a very impressive ALCS, during which he hit .313/.353/.688, with three homers and nine runs scored in seven games. His team lost, but his performances added another item to his accomplished postseason resume. He’s now played in 103 post-season games, ranking seventh all-time, and his name is all-over the career postseason leaderboard (courtesy FanGraphs):
During the series, there was talk about Altuve’s future Hall of Fame possibilities. He just completed his age-33 season and was as good as ever despite missing almost half the season with injuries. His 154 wRC+ was the third-highest of his career and this came after last year’s 164 wRC+, which was the highest of his career (wRC+ is a metric that adjusts for league and ballpark effects where 100 is league average; a 154 wRC+ means Altuve was 54% better than league average on offense in 2023). Altuve is essentially having a second peak, like a two-humped Bactrian camel as opposed to the typical one-humped dromedary. Altuve seemed to top out as a hitter back in 2016 and 2017 (152 wRC+ and 160 wRC+) when he was at the typical peak ages of 26 and 27 years old. As he hit his late 20s and early 30s, his wRC+ dropped into the 130-range, with the truly awful 2020 COVID season being a major outlier (74 wRC+). Now he’s back where he was six years ago and you have to wonder what the future brings. Jose Altuve is famously a small person, especially compared to his fellow professional baseball players. There’s an iconic image of Altuve standing next to an incredibly large person, Aaron Judge, that boggles the mind. How can two players so different in size both be so good at the same sport? When you see the picture of them standing side by side, you might think Altuve is a thoroughbred racehorse jockey and Judge is an NFL tight end. Aaron Judge is listed at six-foot-seven and 282 pounds, while Altuve is officially listed at five-foot-six and 166 pounds. That height is very doubtful, to say the least. I don’t think anyone actually believes that Altuve is five-foot-six, but that’s his “official” height. Five years before Altuve reached the major leagues, another diminutive second baseman made his debut. Dustin “Pee Wee” Pedroia came up with the Boston Red Sox as a 22-year-old in 2006. He’s listed at five-foot-nine and 175 pounds, which is just as doubtful as Altuve’s listed height and weight. They played the same position, second base, and hit homers, stole bases, and sparked their teams to postseason success. Pedroia was a key part of a Red Sox team that made the playoffs eight times in his 14 years, which included three World Series titles. Altuve has played on eight playoff teams in his 13 years with Houston and has two World Series titles. Pedroia was the 2007 AL Rookie of the Year and 2008 AL MVP. He made the All-Star team four times. Altuve doesn’t have a Rookie of the Year award, but did win the 2017 AL MVP award and has been an All-Star eight times. Both players approached home run hitting the same way—grip it and rip it to left field. That’s where their power was and is. The spray charts below show the home runs hit by Altuve and Pedroia in their careers. The vast majority of their dingers landed in the left field seats, with many of Altuve’s finding a home in the Crawford Boxes and many of Pedroia’s flying over the Green Monster. 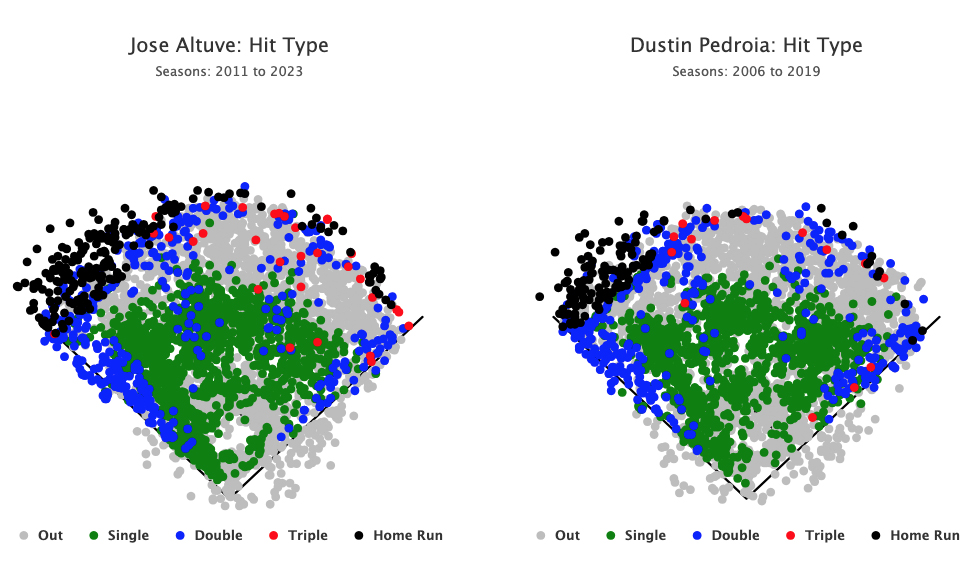
Pedroia was confident. Some might say cocky. He had a swagger about him whenever he took the field. He gave us the phrase “Laser Show.” He was loved by Red Sox fans and his teammates, even those who played with him for nine seasons and still didn’t know his real first name. Opposing fans may have hated him, but they had to respect him. Altuve doesn’t have the big personality that Pedroia had, but when a guy his size establishes himself in the big leagues as a light-hitting, base-stealing second baseman, then bangs out four straight 200-hit seasons and steals 39 bases per year while hitting .334/.384/.496 and morphing into a 20-plus home run hitter, which Altuve did from 2014-2017, fans all across baseball couldn’t help but root for him. Of course, then came the revelation of the Houston Astros cheating scandal and that all changed for Altuve. Now he and Alex Bregman, the last remaining Astros from the 2017 team, are among the most-booed players in baseball when playing on the road. That’s a story for another day, but it should be noted that the data analyzed at the Sign Stealing Scandal website shows Altuve was a minimal participant. As for Pedroia, he retired as a much-loved player whose career ended too soon because of injuries. The charts below show the two player’s careers lined up by age. They both established themselves as above-average players at the age of 23, then had their first great years at age 24. That was Pedroia’s MVP year when his good hitting and impressive defense led to a 6.4-WAR season, the second-best of his career. Altuve’s age-24 season was his first well above average offensive year, with a 137 wRC+, and a league-leading 56 stolen bases. 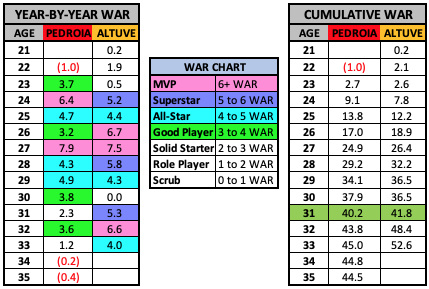
After their big age-24 seasons, both Pedroia and Altuve reeled off good-to-great seasons for the rest of their 20s. They were both particularly good at age 27, when Pedroia had a career-high 7.9 WAR and Altuve had a career-high 7.5 WAR (his MVP year). Altuve had the anomaly of a season in the 2020 COVID year at age 30 before bouncing back with a vengeance, while Pedroia started to wind down a bit as he hit his 30s. He had his last good year at age 32, then played in just 105 games at age 33, before injuries really took their toll and he hardly played at all at ages 34 and 35. I’ve highlighted the age-31 years for Pedroia and Altuve in green on the chart on the above right. At that point, they weren’t far apart in career WAR, with just a 1.6-WAR advantage for Altuve. The chart below show where they ranked among all second basemen in baseball history through their age-31 seasons: 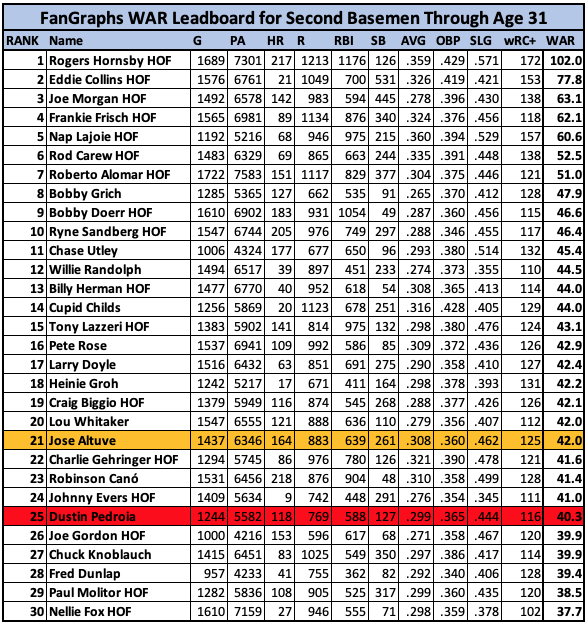
Mixed in and around Altuve (21st) and Pedroia (25th) were some future Hall of Fame second basemen, including some players from well in the past along with two from the last 50 years--Paul Molitor (29th) and Craig Biggio (19th). Pedroia was a good player again at age 32 when he played in 154 games, had 698 plate appearances, and hit .318/.376/.449 (121 wRC+). The end came quickly, though, starting with the 2017 season, when he was 33 years old. His first stint on the Injured List came at the end of May, but it was only a sprained left wrist and he returned after just 10 days. On August 1, he was put on the IL with left knee inflammation. He tried to get back on the field not long after, but was placed back on the IL on August 12. He returned in September to play 19 games, but struggled at the plate, hitting .242/.320/.318 (70 wRC+). After the 2017 season, Pedroia had cartilage restoration surgery on his left knee, which caused him to miss the first seven weeks of the 2018 season. He was activated from the IL on May 25, but right back on it on June 2 after playing in just three games. He never returned that season as the Red Sox cruised to 108 wins and a World Series title. It was a similar story in 2019. He had another surgery on the knee in the offseason which caused him to start the year on the IL. Through multiple IL stints, he played in just six games in what would be his final year on the field. His 44.5 career WAR ranks 30th all-time among second baseman, one spot behind Hall of Famer Nellie Fox. While Pedroia’s career took a downward turn in his early-30s and was essentially over after his age-33 season, Altuve just had a 4-WAR season despite missing the first six weeks while recovering from surgery to repair his fractured right thumb courtesy of a hit-by-pitch in the World Baseball Classic. He later had discomfort in his left oblique that caused him to miss another 20 days. He was top-notch when on the field, though, and has moved up considerably on the all-time WAR list for second basemen. The following chart shows the WAR leaders at second base through the age of 33. 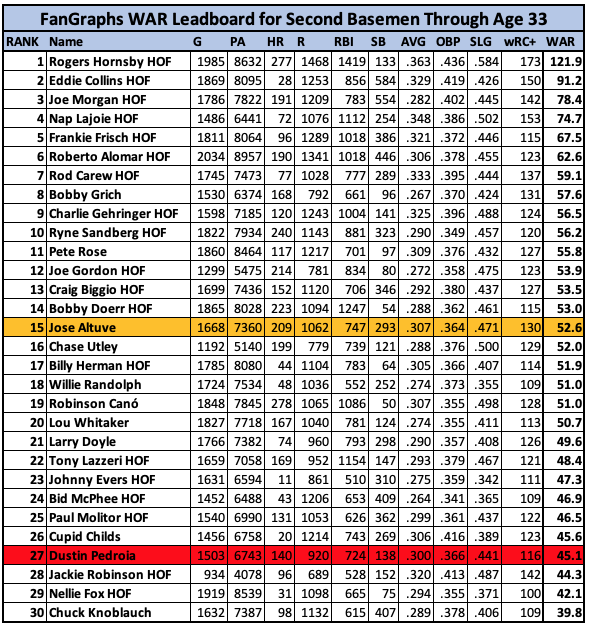
When their age 32 and 33 seasons are added to the mix, Pedroia drops a couple spots on the leaderboard through age-33, while Altuve shoots up to 15th, right on the heels of three Hall of Famers. On the overall career WAR leaderboard for second basemen, Altuve ranks 22nd, right between Hall of Famers Bobby Doerr and Tony Lazzeri. With another good season in 2023 under his belt, and his postseason success, he continues to build his case for the Baseball Hall of Fame. A back-of-the-envelope method of forecasting future WAR was created by Tom Tango with this post at his blog. If I followed his method correctly, the very rudimentary forecast for Jose Altuve’s remaining years would be WARs of 3.5, 2.7, 2.1, 1.5, 0.9, then he would be near replacement-level at age 39. That adds up to 10.7 WAR which, when combined with his current 52.6 WAR, would give him 63.3 for his career. That would place him 12th all-time, just behind Roberto Alomar (63.6 WAR). Another quick-and-easy way to consider what Altuve might do in the future is shown below. I used the five second basemen directly above and the five directly below Altuve on the chart from earlier and added their career WAR to find the WAR they contributed after age 33. The average for these 10 players was 9.6 WAR after age 33. The median was 8.4. If you split the difference and give Altuve nine additional WAR, he would finish his career with 61.6, which would rank 14th, tied with Chase Utley and slightly ahead of Hall of Famers Ryne Sandberg and Joe Gordon. 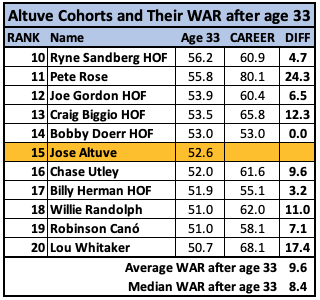
Dustin Pedroia and Jose Altuve were near equals in career value through age 31 before their roads started to diverge. At the time, they both had Hall of Fame potential. Injuries have ended that dream for Pedroia, while Altuve continues his journey to the stage at Cooperstown, where he hopes the cheers of Astros fans will drown out whatever boos may come his way. -Bobby Mueller The post Jose Altuve, Dustin Pedroia, and Divergent Roads appeared first on Off The Bench. via Off The Bench https://www.offthebenchbaseball.com/2023/10/31/jose-altuve-dustin-pedroia-and-divergent-roads/?utm_source=rss&utm_medium=rss&utm_campaign=jose-altuve-dustin-pedroia-and-divergent-roads With Kyle Schwarber and his fellow Phillies hitting bombs right and left in October, it’s a good time to take a closer look at Schwarber’s 2023 regular season. By some traditional statistics, he had a terrific season. He hit 47 homers, second-most in baseball, scored 108 runs, which was tied for eighth, and had 104 RBI, eleventh-most in the game. He was one of just eight players to both score and drive in 100 or more runs. He also had a .197 batting average, which was the lowest in baseball among qualifying hitters, and struck out 215 times, the most in baseball in 2023 and fifth-most in a season ever. Fans who care strongly about traditional numbers might wonder how that all fits together. How good was Kyle Schwarber, really? Setting aside the traditional numbers, Schwarber’s prodigious power and ability to get on base—he walked 126 times, second only to Juan Soto’s 132—allowed him to put up a .343 OBP and .474 slugging percentage. Ignore the .197 batting average. On-base percentage and slugging percentage are the key ingredients to offensive production and Schwarber’s .343 OBP and .474 slugging percentage were both higher than the MLB averages of .320 and .414. He was a good hitter. According to FanGraphs, Schwarber had a 119 wRC+, which means he was 19 percent better than the average hitter after league and ballpark effects were taken into account. Two hitters with the same 119 wRC+ as Schwarber were Baltimore’s Anthony Santander and the Dodgers’ Will Smith. Santander is an adequate outfielder who was worth 2.6 Wins Above Replacement (WAR), per FanGraphs. Catcher Will Smith, playing a much more demanding position, was worth 4.4 WAR. Schwarber, despite being the same quality hitter as Santander and Smith, was worth 1.4 WAR. Wait, what? The “R” in WAR stands for replacement, as in replacement-level player. Schwarber was better than a replacement-level player, but didn’t reach the 2 WAR that denotes an average player, making him a below-average player overall. How can a guy who launched 47 dingers, scored 108 runs, and had 104 RBI be a below-average player? It doesn’t seem possible. We know the hitting value was there. So where did Schwarber come up short? Baserunning was a small part of it. He didn’t steal a base and wasn’t particularly adept at getting around the bases because of his tortoise-like speed. His Baserunning value was slightly negative. The main issue was his spectacularly bad fielding. Schwarber ranked at the very bottom of the list in the FanGraphs defensive metric among the 140 players with 800 or more innings in the field at any position. His buddy in the Philadelphia outfield, Nick Castellanos, ranked 138th (Vladimir Guerrero Jr. was 139th). The following chart is from the FanGraphs glossary: Rules of Thumb
Schwarber is down there in the “Awful” portion of the scale. Not average, not below average, not even poor. Awful. Defensive metrics vary among different sites, so let’s get another opinion. Baseball-Reference uses a different metric for measuring defense, but the results were pretty much the same. Schwarber ranked 30th of 30 left fielders with at least 60 games played in the Baseball-Reference Defensive WAR metric (dWAR). And his -2.8 dWAR wasn’t even close to the two players directly above him on the list, Bryan De La Cruz (-1.4 dWAR) and Jurickson Profar (-1.4 dWAR). That’s a massive gap from second-worst to worst. Baseball Savant has a Statcast-based defensive metric that utilizes trackman cameras to create catch probabilities. Their metric is Outs Above Average. Schwarber’s Outs Above Average was -19, which ranked in the 1st percentile. The player closest to him on this list for left fielders was again Jurickson Profar, at -13. According to Statcast, the main issue with Schwarber’s defense is a total lack of range. He has 7th percentile speed and doesn’t read fly balls well, so his range is in the 1st percentile and he doesn’t make up for it with his throwing arm, which is also well below average. Statcast fielding ranks for Kyle Schwarber: Range—1st percentile Arm value—8th percentile Arm strength—23rd percentile Three different metrics from three different sites agree that Kyle Schwarber was terrible in the field in 2023, but could he really have been so bad that his 47 homers and 119 wRC+ wasn’t enough to make him an average player? Let’s take a look at some of Kyle Schwarber fielding attempts, courtesy baseball savant. This should have been an easy fly out to left. Catch probability: 99% Opportunity time: 3.2 seconds Distance Needed: 11 feet What’s the opposite of a Gold Glove? Maybe Schwarber should get the Cast Iron Skillet Award. Catch probability: 99% Opportunity time: 3.7 seconds Distance Needed: 40 feet “He’s got no range.” Truer words have never been spoken. Catch probability: 99% Opportunity time: 4.5 seconds Distance Needed: 53 feet Catch probability: 95% Opportunity time: 4.1 seconds Distance Needed: 53 feet Trea, I’m gonna let you take that one. Oh. Catch probability: 90% Opportunity time: 5.8 seconds Distance Needed: 104 feet So much hang time, so little speed. Catch probability: 85% Opportunity time: 5.8 seconds Distance Needed: 105 feet The half-dozen plays shown here is a sample of Schwarber at his worst, but his defensive value at the various sites was based on all the plays he did and did not make throughout the season and they all agree that he was really bad. Because of the injury to Bryce Harper that limited him to DH for much of the season, the Phillies were forced to play Schwarber in left field much more often than they would have liked. The Phillies knew he was bad, but didn’t have a choice. When Harper was healthy enough to play first base regularly in September, Schwarber was shifted to DH. From September 5 through the end of the season, Schwarber started five games in left field and 19 at DH. He’s also started every postseason game at DH because that’s where he and his cast iron skillet glove belong. The post Looking for the WAR in SchWARber appeared first on Off The Bench. via Off The Bench https://www.offthebenchbaseball.com/2023/10/21/looking-for-the-war-in-schwarber/?utm_source=rss&utm_medium=rss&utm_campaign=looking-for-the-war-in-schwarber Sports have been giving us inspiration for ages, not just for athletes but for anyone looking to be a top-notch leader. These captains and coaches in the sports world are like gold mines of leadership wisdom that go way beyond the game. Let’s dive into some of the topleadership lessons we can pick up from these heavy hitters. Lead by ExampleCaptains and coaches they’re the real deal when it comes to leading by showing how it’s done. They don’t just talk the talk; they walk the walk. That lesson is a reminder that great leaders never ask their team to do something they wouldn’t do themselves. Whether it’s burning the midnight oil in practice or giving it their all, leading by example earns respect and fires up the team. CommunicationSuccessful coaches and captains are top-notch communicators. They know how to lay out their game plan, give constructive feedback, and really listen to their teammates. Clear communication builds trust and gets everyone on the same page, working together like a well-oiled machine. AdaptabilityIn the wild world of sports, captains and coaches have to be quick on their feet. Whether it’s adapting to a new opponent’s moves or dealing with curveballs like unexpected injuries, being adaptable is a must. Leaders need to be ready to change up their game plan on the fly to snag that win. Motivation and InspirationCaptains and coaches are also the hype masters. They know that to reach the summit, you’ve got to light a fire to win in the players. Leaders should see the unique talents in their team and inspire them to push their limits. Motivation, often born from a shared dream of success, is a potent weapon in leadership. AccountabilityBoth captains and coaches own up to wins and losses. They hold themselves accountable and push their team to do the same. Leaders need to create a culture of responsibility, where everyone takes charge of their actions and joins forces to level up. Teamwork Makes the Dream WorkSports teams thrive on tight-knit teamwork. Captains and coaches? They get that working together as a unit is the secret sauce. They create an environment where every player feels valued. This lesson is a reminder that strong personal connections and that feeling of belonging are key in leadership. Keep on LearningThe sports world never stops evolving, and the top dogs are all about constant learning. They keep tabs on the latest strategies, techniques, and trends to keep their teams ahead of the game. It’s a reminder that staying curious and open to new knowledge is a must in leadership. Resilience and PerseveranceWhen tough times hit, captains and coaches show they’ve got nerves of steel. They teach us that setbacks are part of the journey; what matters is how you bounce back. Leaders should be ready to face challenges head-on and inspire their teams to do the same. Thinking StrategicallyCoaches, especially, are known for their chess-like thinking. They craft game plans, size up the competition, and make game-changing decisions under pressure. It’s a reminder that strategic thinking is a big deal in leadership. Leaders should anticipate roadblocks and plan their way to success. In the end, the sports world is a goldmine of leadership lessons that go way beyond the field. Captains and coaches are living proof of these lessons. They hammer home the importance of leading by example, nailing communication, staying adaptable, bringing the hype, taking responsibility, working as a team, always learning, being tough as nails, thinking strategically, and embracing both victories and defeats. If we weave these gems into our own leadership roles, we can step up our game and become top-notch leaders in any part of life. The post Leadership Lessons from Captains and Coaches in Sports first appeared on Louis DeTitto's Sports Blog. via Louis DeTitto's Sports Blog https://louisdetitto.net/leadership-lessons-from-captains-and-coaches-in-sports/?utm_source=rss&utm_medium=rss&utm_campaign=leadership-lessons-from-captains-and-coaches-in-sports Though scaling a business is usually an exceptional and fulfilling experience, it also comes with many challenges. While we all think growth often translates to more revenues and a broader market base, which is true sometimes. But, at the same time, it presents an entirely new maze of complexities and uncertainties. One of the biggest determinants of long-term success is overcoming and navigating these challenges. This article looks at some common entrepreneurial hurdles you’re likely to encounter as you scale and offers tips on overcoming them. Coping with Rapid GrowthScaling your business means rapid growth, and while more growth is good, it can be tricky, too. Your team may need more time to be ready for the surge in demand. Your operations infrastructure may need more time to be prepared for the inevitable increase in orders that comes with exponential sales growth. A solution to this challenge would be to plan for growth ahead of time. Evaluate your resources, recruit and train staff, and even outsource some of the functions to cope with increased demand. Scaling should be well-managed as opposed to being reactive. Quality ControlMaintaining quality as the business grows may prove quite tasking. You not only have to live up to the customer’s expectations but also give your best, and even more than that, to retain customers. To address this problem:
Capital for Scaling a BusinessScaling demands money. You may need new equipment, more staff, opening another location, or expanding your marketing effort. You will definitely need access to capital. Consider other avenues of financing, such as bank loans, venture capital, angel investors, or crowdfunding. Keep your business’s financial situation under constant review and make wise decisions concerning finances that will foster growth. Talent Recruitment and HiringOne of the toughest things as you scale is getting the best people and keeping them. The right team makes your company move even faster, but contacting that class of people can be hard. Develop a great employer brand, write compelling job descriptions, and offer competitive compensation packages. Look beyond skills and experience for cultural fit and alignment with your organizational values and mission. Scalable Systems and TechnologyOut-dated systems and technology can be another barrier to scaling effectively. Make sure that your business has scalable software and infrastructure. Put in place systems that would grow and expand along with your business, as well as have the flexibility to mold it according to its changing needs. Some of these may be customer relationship management (CRM) systems and inventory management software, among others, such tools for process automation. The Competitors and Market ExpansionScaling your business sometimes means you have to enter new markets or expand your presence in the existing ones. Knowing the distinct challenges and demands of these markets is inevitable. In-depth market research is thus key to understanding potential competitors, target customers, and market trends. Adapting your products and services as marketing strategies to suit the needs of these markets will be paramount in ensuring success. Maintaining Company CultureAs the business grows bigger, it becomes increasingly harder to maintain the company culture, which has been its bedrock in achieving success. And, as you add new people and expand into new locales, adherence to your mission and cultural values counts as well. Articulate the mission and values of your firm often throughout the organization and select for cultural fit when hiring new hires. Scaling the business is a tricky thing. You will run into all sorts of challenges. Still, with careful planning and agility in your approach to work, putting customers before yourself, and focusing on quality results, you can overcome all the challenges. And lastly, remember scaling is a marathon, not a sprint. Taking time to address these challenges as they occur will ultimately help ensure the long-term growth and sustainability of your business. Stay committed to your vision, and be open to pivoting and innovating as you face new challenges on this journey to scale. The post Navigating the Challenges of Scaling a Business first appeared on Louis DeTitto | Business. via Louis DeTitto | Business https://louisdetitto.com/navigating-the-challenges-of-scaling-a-business/?utm_source=rss&utm_medium=rss&utm_campaign=navigating-the-challenges-of-scaling-a-business |
 RSS Feed
